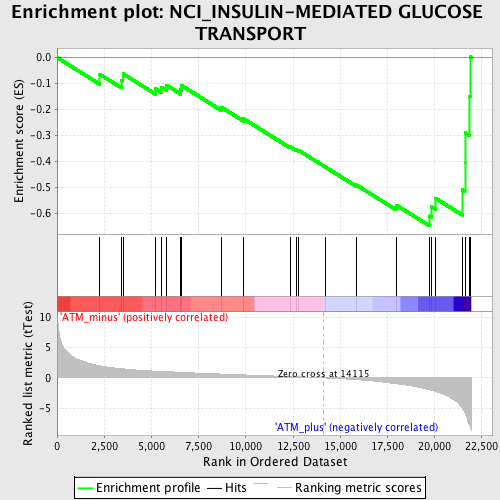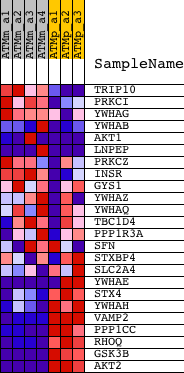
Profile of the Running ES Score & Positions of GeneSet Members on the Rank Ordered List
| Dataset | Set_01_ATM_minus_versus_ATM_plus.phenotype_ATM_minus_versus_ATM_plus.cls #ATM_minus_versus_ATM_plus.phenotype_ATM_minus_versus_ATM_plus.cls #ATM_minus_versus_ATM_plus_repos |
| Phenotype | phenotype_ATM_minus_versus_ATM_plus.cls#ATM_minus_versus_ATM_plus_repos |
| Upregulated in class | ATM_plus |
| GeneSet | NCI_INSULIN-MEDIATED GLUCOSE TRANSPORT |
| Enrichment Score (ES) | -0.6498002 |
| Normalized Enrichment Score (NES) | -1.8390292 |
| Nominal p-value | 0.002020202 |
| FDR q-value | 0.030091597 |
| FWER p-Value | 0.385 |

| PROBE | DESCRIPTION (from dataset) | GENE SYMBOL | GENE_TITLE | RANK IN GENE LIST | RANK METRIC SCORE | RUNNING ES | CORE ENRICHMENT | |
|---|---|---|---|---|---|---|---|---|
| 1 | TRIP10 | 1418092_s_at | 2265 | 1.975 | -0.0650 | No | ||
| 2 | PRKCI | 1417410_s_at 1448695_at | 3408 | 1.506 | -0.0878 | No | ||
| 3 | YWHAG | 1420816_at 1420817_at 1450012_x_at 1459693_x_at | 3489 | 1.477 | -0.0628 | No | ||
| 4 | YWHAB | 1420878_a_at 1420879_a_at 1420880_a_at 1436783_x_at 1438708_x_at 1455815_a_at | 5228 | 1.094 | -0.1208 | No | ||
| 5 | AKT1 | 1416657_at 1425711_a_at 1440950_at 1442759_at | 5518 | 1.047 | -0.1137 | No | ||
| 6 | LNPEP | 1433747_at 1438432_at 1439326_at 1443907_at 1456347_at | 5790 | 1.011 | -0.1064 | No | ||
| 7 | PRKCZ | 1418085_at 1449692_at 1454902_at | 6548 | 0.906 | -0.1234 | No | ||
| 8 | INSR | 1421380_at 1450225_at | 6601 | 0.897 | -0.1083 | No | ||
| 9 | GYS1 | 1450196_s_at | 8692 | 0.622 | -0.1916 | No | ||
| 10 | YWHAZ | 1416102_at 1416103_at 1436971_x_at 1436981_a_at 1439005_x_at 1443893_at 1448218_s_at 1448219_a_at | 9868 | 0.485 | -0.2358 | No | ||
| 11 | YWHAQ | 1420828_s_at 1420829_a_at 1420830_x_at 1432842_s_at 1437608_x_at 1454378_at 1460590_s_at 1460621_x_at | 12338 | 0.217 | -0.3443 | No | ||
| 12 | TBC1D4 | 1435292_at 1455903_at | 12653 | 0.182 | -0.3550 | No | ||
| 13 | PPP1R3A | 1422108_at | 12797 | 0.164 | -0.3584 | No | ||
| 14 | SFN | 1448612_at | 14234 | -0.019 | -0.4235 | No | ||
| 15 | STXBP4 | 1442267_at 1446648_at 1451063_at 1453989_at 1455706_at | 15851 | -0.291 | -0.4916 | No | ||
| 16 | SLC2A4 | 1415958_at 1415959_at | 17966 | -0.969 | -0.5693 | No | ||
| 17 | YWHAE | 1426384_a_at 1426385_x_at 1435702_s_at 1438839_a_at 1440841_at 1457173_at | 19732 | -1.981 | -0.6113 | Yes | ||
| 18 | STX4 | 1451573_a_at | 19834 | -2.044 | -0.5762 | Yes | ||
| 19 | YWHAH | 1416004_at | 20026 | -2.200 | -0.5422 | Yes | ||
| 20 | VAMP2 | 1420833_at 1420834_at | 21473 | -5.028 | -0.5105 | Yes | ||
| 21 | PPP1CC | 1440594_at | 21604 | -5.797 | -0.4038 | Yes | ||
| 22 | RHOQ | 1427918_a_at 1440925_at | 21607 | -5.827 | -0.2907 | Yes | ||
| 23 | GSK3B | 1434439_at 1437001_at 1439931_at 1439949_at 1451020_at 1454958_at | 21861 | -7.833 | -0.1500 | Yes | ||
| 24 | AKT2 | 1421324_a_at 1424480_s_at 1455703_at | 21877 | -7.894 | 0.0027 | Yes |

